
Table of Content
Why Do B2B eCommerce KPIs Matter?
What are B2B eCommerce KPIs and Why Do They Matter?
B2B eCommerce KPIs (key performance indicators) are measurable numbers that tell you how well your online store is performing.
Key examples include conversion rate (the percentage of visitors who actually buy), average order value (how much each customer spends per order), cart abandonment rate (how often buyers leave without checking out), customer lifetime value (total revenue you expect from one customer), and quote-to-order ratio (how many requested quotes turn into actual sales).
Why do they matter?
Tracking these metrics helps B2B businesses spot problems in the buying process, improve the checkout experience, and make data-driven decisions to grow revenue.
The right B2B eCommerce KPIs:
- Provide measurable insights into performance
- Highlight inefficiencies and opportunities
- Align teams with shared goals
- Empower smarter decisions at every level
But not all KPIs are created equal. The best ones are:
- Impactful: They influence your bottom line.
- Accurate: They reflect real-time performance.
- Actionable: They lead to clear next steps (e.g. quote acceptance is 60% vs. industry 70%, so the business is losing deals to complexity)
Here are a few B2B eCommerce KPIs your business should be tracking for your online eCommerce store.
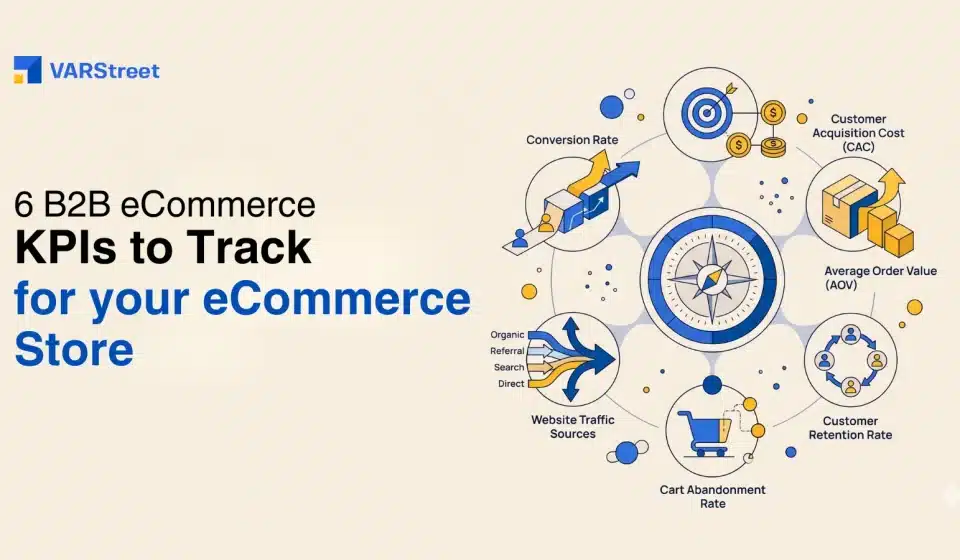
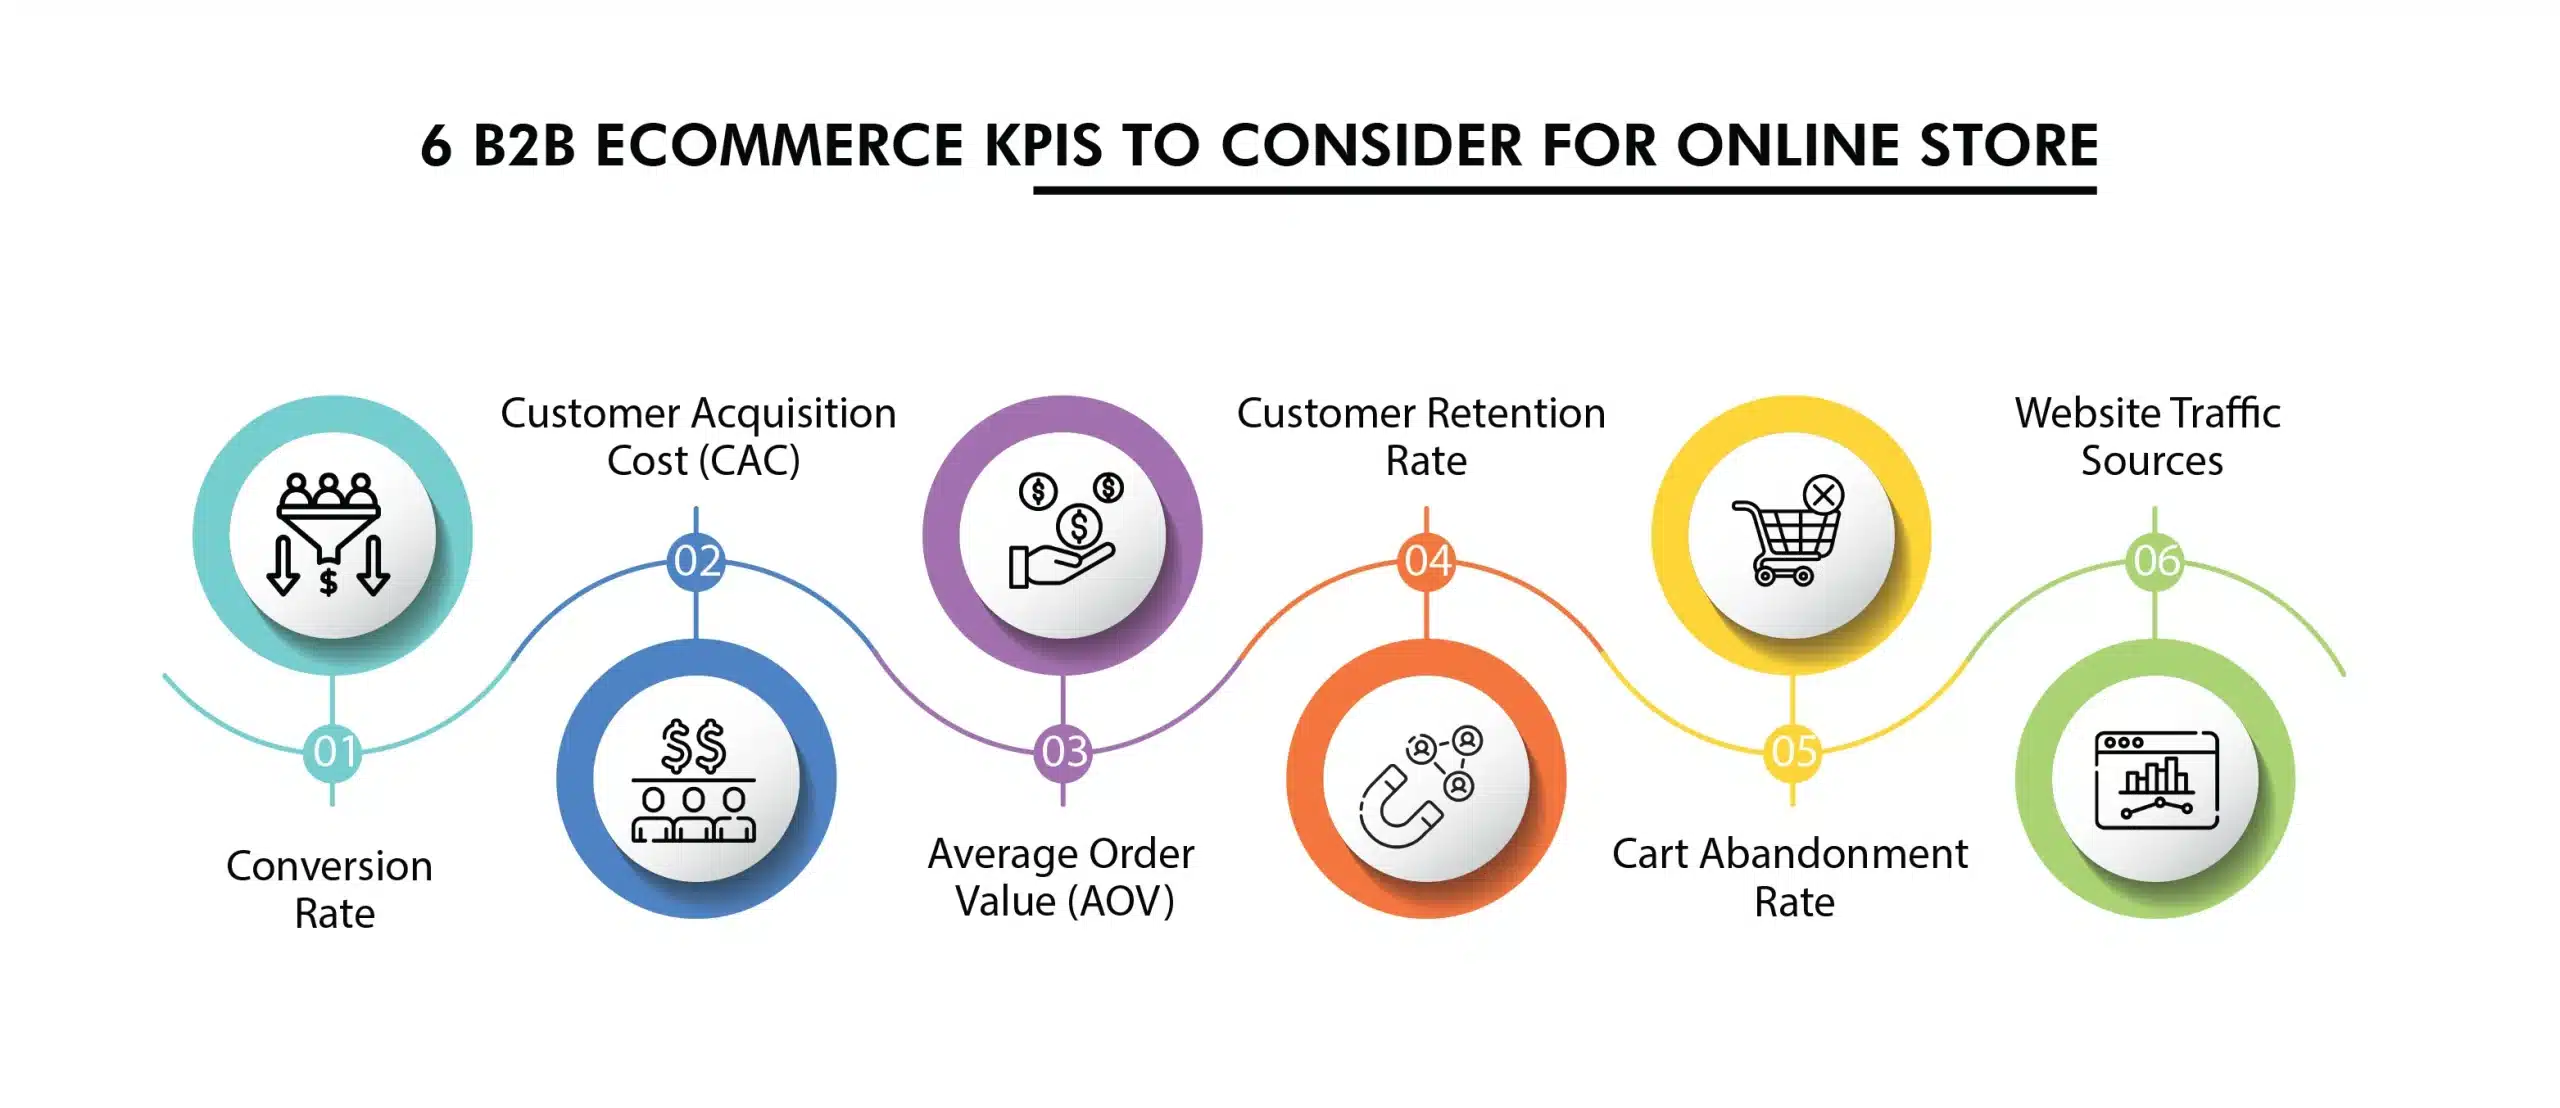
Here Are 6 B2B eCommerce KPIs To Consider For Online Store
1. Conversion Rate
What it measures: The conversion rate tracks the percentage of website visitors who complete a key action, whether that’s making a purchase, filling out a lead form, requesting a demo, or signing up for a newsletter.
Formula: (Number of Conversions/Total Visitors)*100
Why it matters: Your conversion rate is the heartbeat of your digital funnel. It shows how compelling your site experience truly is. High traffic is only half the battle. If your visitors aren’t taking action, you’re leaving revenue on the table.
A subpar conversion rate can signal friction in your user journey, weak messaging, or ineffective calls-to-action (CTAs). On the flip side, strong conversion rates are a direct result of a smart, customer-centric marketing strategy.
Depending on the industry, average B2B eCommerce conversion rates vary from 2.5% to 4.0%(BookYourData).
Here is how you can land on the higher end of this range:
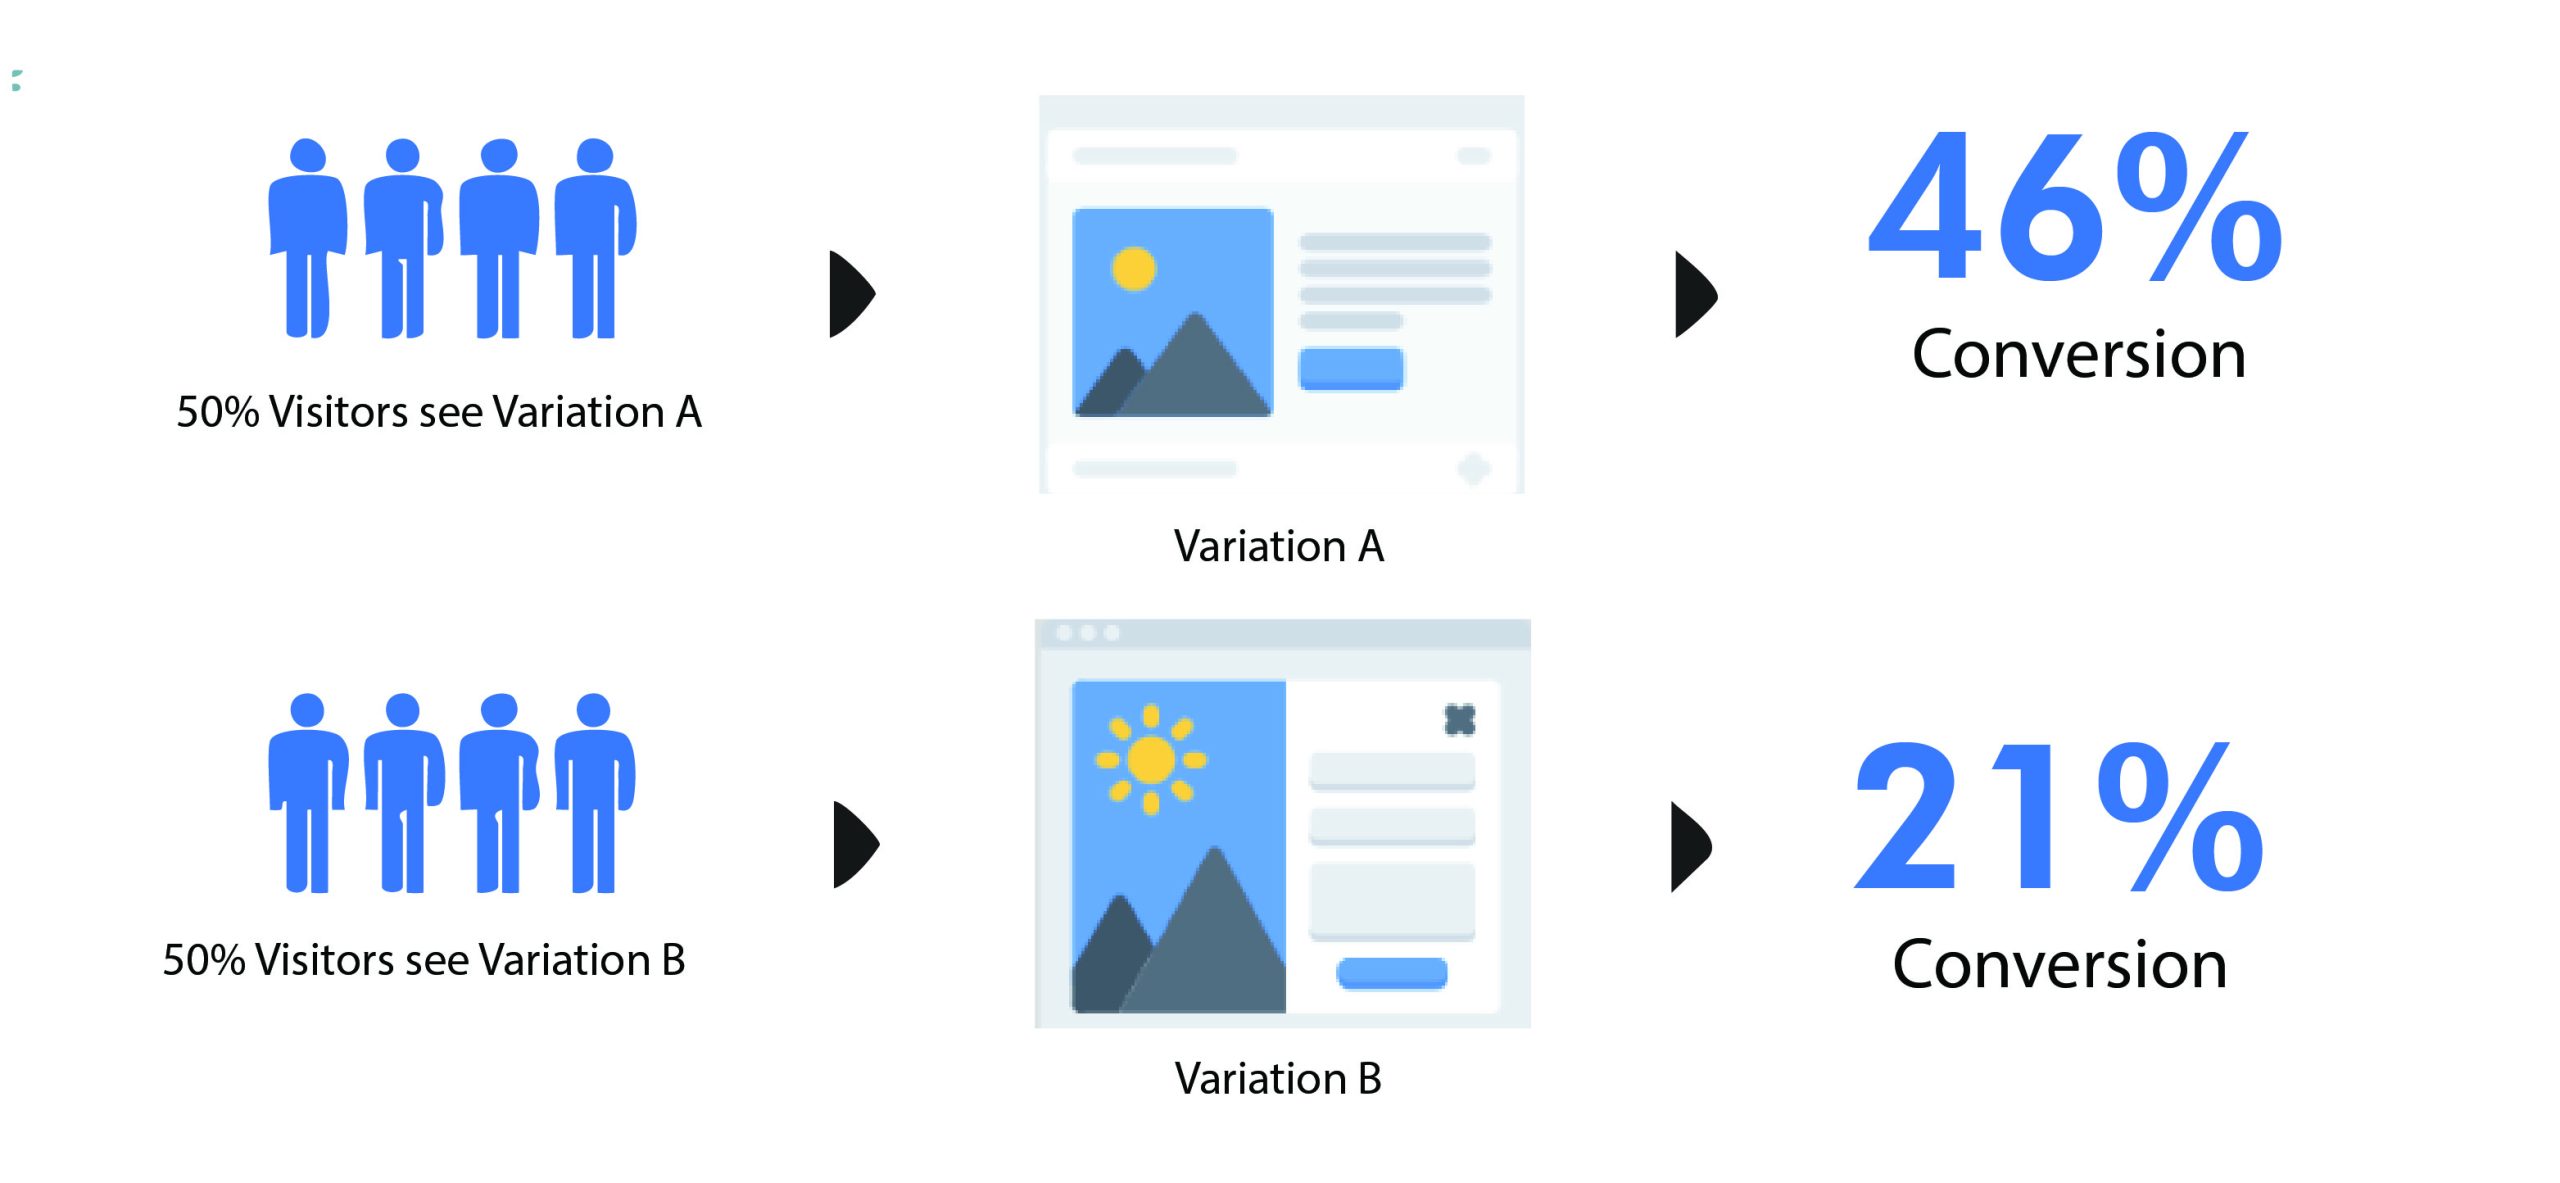
- Run A/B Tests with Intent: Test headlines, CTA placements, form lengths, and visuals to discover what resonates with your audience.
- Personalize the Experience: Using behavioral data, recommend the appropriate products or content to the right people at the right time. Personalization marketing strategies are vital here.
- Streamline the Path to Action: Eliminate unnecessary fields, simplify navigation, and make your CTAs crystal clear and impossible to ignore. Every extra step is a potential drop-off point.
- Leverage Retargeting Campaigns: Do not let warm leads become cold. Use CRM to follow up and attract back visitors who did not convert the first time.
- Align Messaging with Buyer Journey: Ensure your content and offers match the user’s stage in the funnel. Top-of-funnel visitors need education; bottom-of-funnel prospects need urgency and reassurance.
2. Customer Acquisition Cost (CAC)
What it measures: The average cost your company spends to bring on a new client is measured by the Customer Acquisition Cost (CAC). It is calculated by dividing the total amount spent on marketing, sales, and advertising by the number of new clients acquired over a given time frame.
Formula: (Amount of Money Spent to Acquire Customers ÷ Number of Customers Acquired )
Why it matters: CAC is one of the most telling metrics for understanding your business’s long-term sustainability and profitability. Simply put, it shows whether your growth is efficient or expensive. A high CAC can eat into margins and put pressure on your bottom line, especially if those customers aren’t sticking around for repeat purchases.
In the contemporary B2B landscape, where paid ad costs are climbing and competition is fierce, managing CAC is vital for growth. Reducing CAC without sacrificing lead quality is a powerful way to scale without burning through your budget.
Here are some things that can streamline customer acquisition:
- Invest in Content Marketing for Scalable, Organic Growth: Thought leadership, SEO-optimized blog content, product guides, and industry whitepapers help attract qualified leads over time, without paying for every click. It’s the gift that keeps on giving.
- Sharpen Your Paid Campaign Targeting: Every dollar should work harder. Use precise audience segmentation, lookalike audiences, and retargeting strategies to drive higher-quality traffic that converts faster.
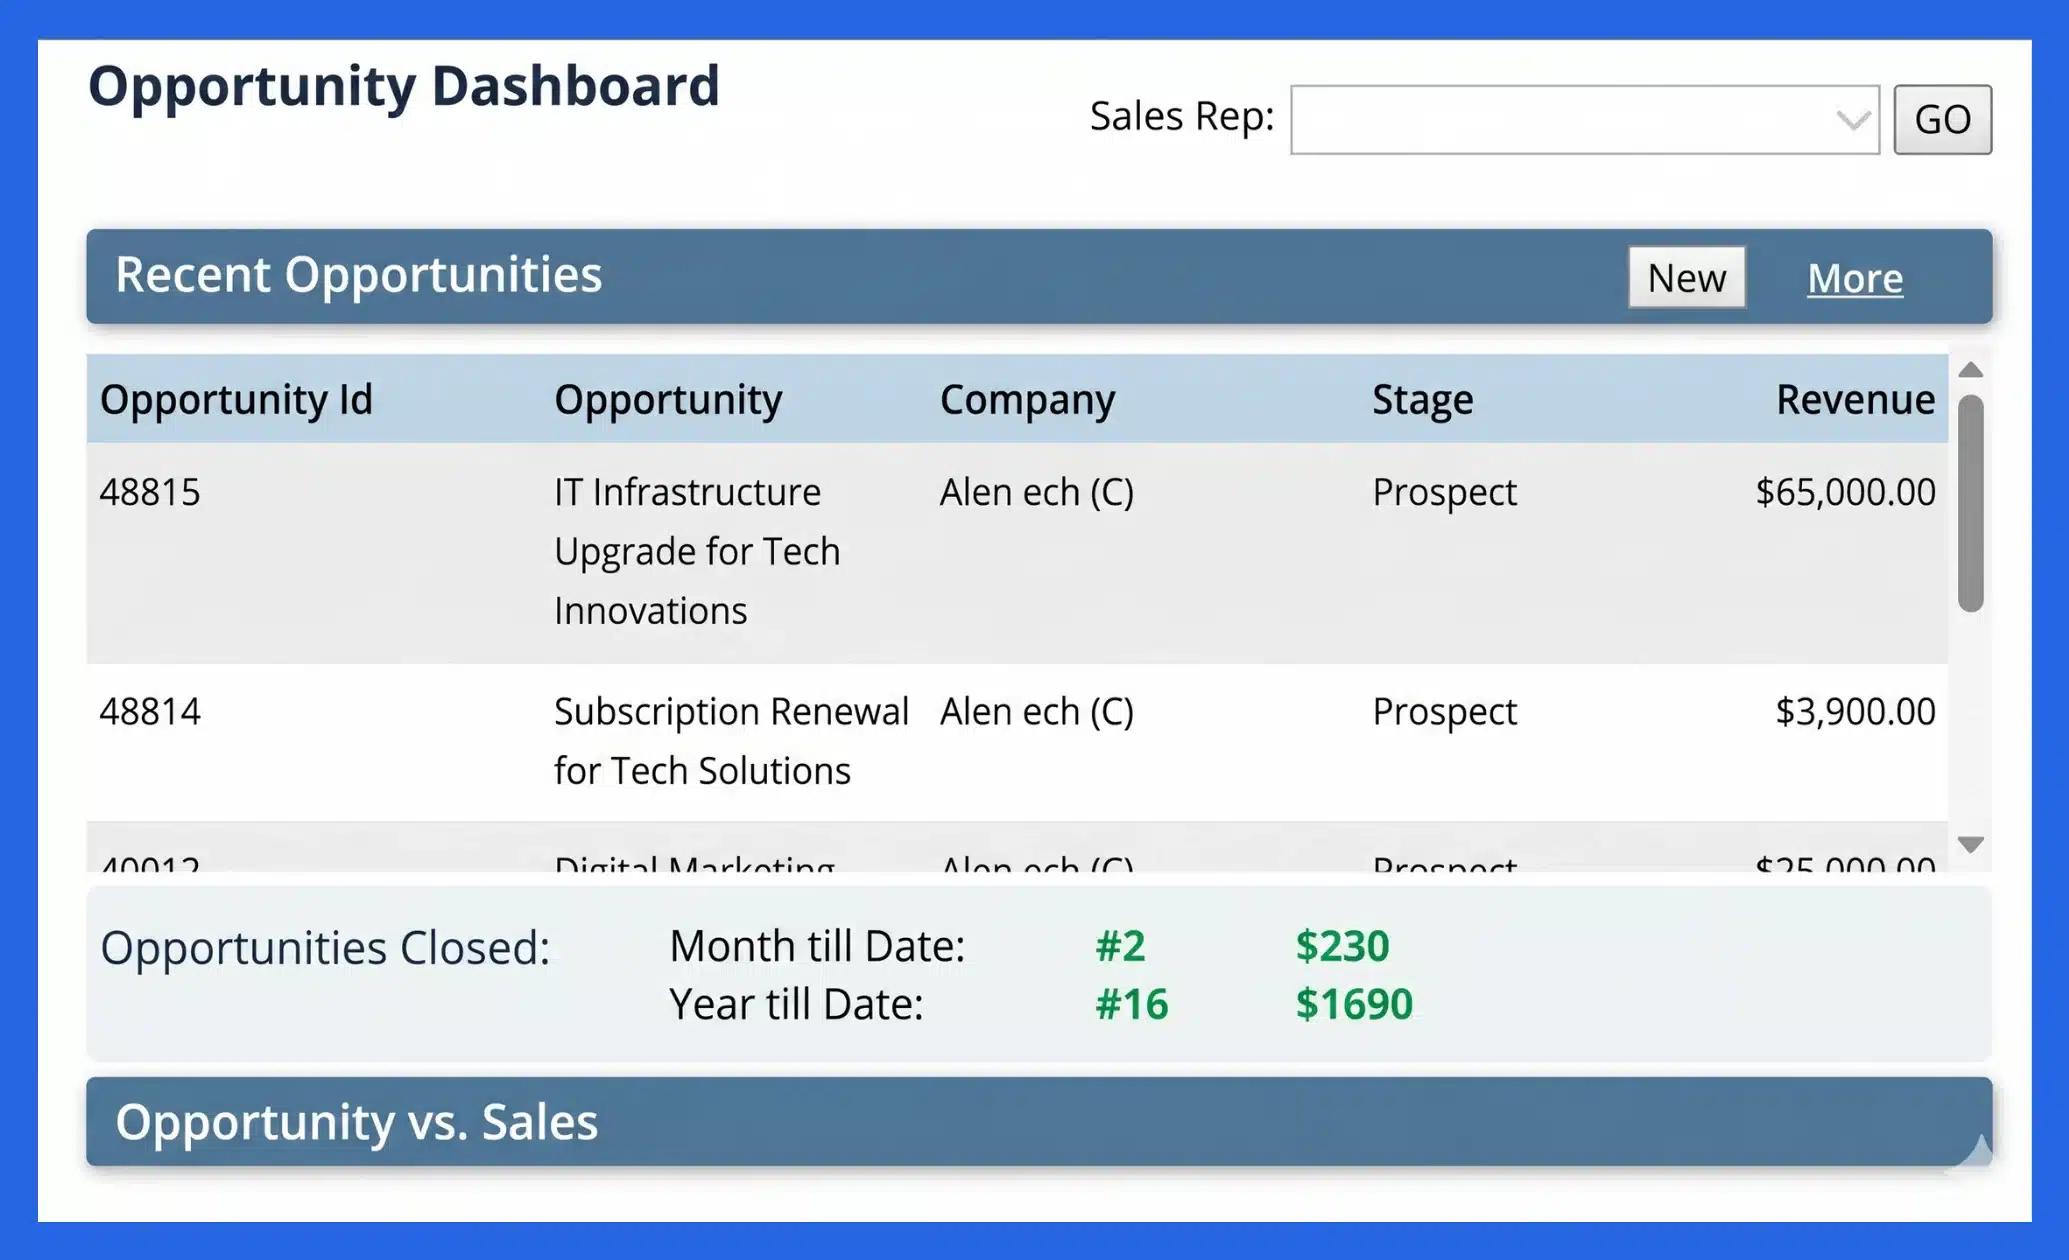
- Streamline Lead Nurturing with VARStreet’s CRM: Don’t let promising leads fall through the cracks. Use VARStreet’s integrated CRM tools to automate follow-ups, personalize outreach, and keep your sales pipeline warm and active. The faster and more intelligently you engage, the more efficient your conversion path becomes.
- Track CAC in Context: Always pair CAC with customer lifetime value (CLTV) to get the full picture. A high CAC is acceptable if you’re acquiring high-value, long-term customers.
3. Average Order Value (AOV)
What it measures: The average amount of money a customer spends on your eCommerce site each time they place an Average Order Value, or AOV, and track a purchase.
Formula: (Total Revenue / Number of Orders)
Why it matters: AOV is a powerful lever for growth because earning more per order allows you to boost revenue without spending more on customer acquisition. In the B2B world, where order volumes and contract sizes can vary widely, increasing AOV can significantly impact your bottom line with minimal additional effort.
Improving AOV is centered around delivering more value, solving more problems per transaction, and making the buying process more efficient for your customers. In the end, it comes down to offering top-notch customer service.
Optimization Tips:
- Bundle Products or Create Tiered Pricing Packages: Offer pre-packaged solutions or volume-based discounts that make larger purchases more attractive to your buyers.
- Recommend Complementary Add-ons: Use intelligent cross-sell and upsell suggestions during checkout. Think of accessories, extended warranties, or related supplies.
- Highlight the Value, Not Just the Price: Position premium offerings with clear ROI, such as time savings, better performance, or longer lifecycle, especially for enterprise buyers.
4. Customer Retention Rate
What it measures: Customer Retention Rate tracks the percentage of existing customers who continue doing business with your company over a specific period, whether through repeat purchases, contract renewals, or subscription reorders.
Formula: [(Customers at the End of the Period – New Customers Acquired) / Customers at the Start of the Period] * 100
Why it matters: Retaining clients is less expensive than obtaining new ones. High levels of satisfaction and brand loyalty indicate a high rate of retention.
In fact, according to Bain and Co., a mere 5% increase in retention can result in a 25%–95% increase in earnings.
A strong retention rate signals customer satisfaction, operational efficiency, and brand trust—all critical for scalable, sustainable growth. (all critical for scalable, sustainable growth).
Here is how you can increase the customer retention rate for your online store:
- Strengthen Onboarding & Customer Support: Ensure new customers feel confident using your product or platform with excellent customer service.
- Introduce Loyalty & Referral Programs: Reward repeat purchases or incentivize customer referrals with discounts, credit, or exclusive access to value-added services.
- Personalize Post-Purchase Communication: Send tailored follow-ups based on purchase history or behavior, whether it’s reorder reminders, upgrade offers, or personalized content that adds value.
5. Cart Abandonment Rate
What it measures: Cart abandonment rate is the percentage of customers who put products in their cart but abandon them before making the purchase.
Why it matters: A high abandonment rate can highlight some issues with your checkout process. For B2B buyers, this could mean complex navigation, hidden fees, or a lack of preferred payment terms. For VARs in particular, abandonment often signals quote complexity, unclear terms, or pricing that doesn’t match what was discussed.
The Baymard Institute reports that the average rate of online cart abandonment is approximately 70.19%, with a variety of causes ranging from technical issues to imprecise pricing.
This is not something you would want for your B2B eCommerce Store.
Here are some optimization tips to reduce the cart abandonment rate:
- Simplify checkout flows
- Offer guest checkout and multiple payment methods
- Use automated cart recovery emails with incentives
6. Website Traffic Sources
What It Measures: Traffic sources tell you where your eCommerce visitors are coming from—be it organic search, paid ads, email campaigns, social media, or referral links. It’s essentially your marketing GPS, pinpointing which channels are driving traffic and fueling your sales pipeline.
Why It Matters: You never know what kind of website traffic you are going to get on your online store. Understanding your traffic mix helps you evaluate which channels are actually delivering value and which are just burning through your budget. For B2B eCommerce businesses, data consistently shows that organic search and email marketing outperform other channels in terms of conversion rates and cost efficiency.
When you know where your audience is engaging most, you can double down on what works and fine-tune or reallocate spend away from what doesn’t. Instead of driving more traffic, your focus should be on driving the right traffic.
Here is how you can get more traffic on your eCommerce store:
- Strengthen SEO strategy for long-term gains
- Invest in email marketing automation
- Allocate spend to high-ROI traffic channels